
5.5.1.3. Impact Assessment Primer 3
Introduction
This contribution to the Impact Assessment Primer Series explores general issues relating to collecting and using data in impact assessments. Issues related to how data are gathered and used are addressed in sections on selecting variables, primary data collection, qualitative data collection, secondary data collection, and combining data sources. Important issues addressed in these sections include how to integrate different types of data in the final analysis and the importance of drawing on different types of data sources to get a more complete and accurate picture of program impact.
Selecting Impact Variables
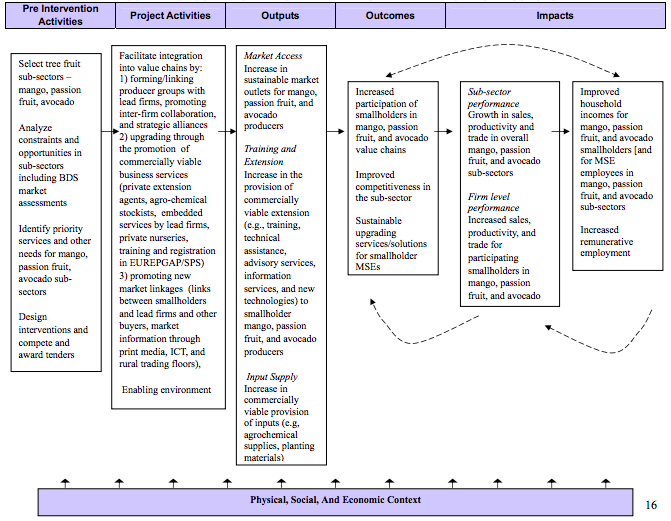
Other papers in the Primer Series address the topic of selecting the impact assessment methodology, including the initial step in the process—the evaluability assessment. In the evaluability assessment, researchers and project staff first study the constraints and opportunities facing the chosen sector or sectors, the proposed project activities and their expected outcomes, and then develop a series of hypotheses about how project interventions will affect the value chain at the levels of interest to the research. These relationships are presented in a causal model showing the causal relationships linking interventions, outputs, outcomes and impacts. In this way, the causal model is used to generate hypotheses about outcomes and impacts that will be tested in the impact assessment. An example of such a causal model may be found in Figure 1, which is the causal morel for an impact assessment of a tree fruit sector development program in Kenya carried out by the PSD Impact Assessment Initiative.[1]
Once the causal model has been defined, the next step is to operationalize the model showing how the various hypothesized relationships can be tested. This is shown in Figure 2, also taken from the Kenya Tree Fruit assessment. Here, the hypotheses identified in the causal model are elaborated in terms of levels of analysis: smallholder tree fruit MSEs, smallholder households and markets for products. Each level in turn includes different domains of impact along with several impact variables in each domain. The final column in Figure 2 shows the sources of information (both quantitative and qualitative) to be used.
At each level of analysis, variables typically fall into one of three categories. The first category is impact variables, which are measures of hypothesized outcomes and impacts. Where impact variables cannot be measured directly with ease or accuracy, proxy indicators are used. Examples would be enterprise profits and household income, proxies for which might be enterprise sales and household expenditures.
The second category is mediating variables, which are characteristics that vary from respondent to respondent and which may help explain observed results. Demographic characteristics (e.g., age, gender, education, or location), program activity (e.g., number and types of services received), and subjective perceptions (attitudes, level of awareness, or knowledge) are the most common mediating variables.
The third category is contextual variables, which are other characteristics that may help explain observed results but which are shared by all respondents. Examples include the weather, infrastructure development, proximity to markets, or the political, social, and economic environment.[2]
")
Levels and Types of Data
The Kenya tree fruit assessment used a mixed methodology approach combining quantitative and qualitative data collection methodologies with primary and secondary data collection. Quantitative methodologies are research methods dealing with numbers and anything that is measurable. They typically involve numerical tabulations and statistical comparisons made possible by systematic surveys, observations, or analysis of records.
In contrast, qualitative methodologies aim to understand, report, and evaluate the meaning of events for people in particular situations. The focus of qualitative methodologies is the way in which participants (rather than the researcher) interpret their experiences and construct reality. Common examples include unstructured or semi-structured interviews, focus group discussions, open-ended questionnaires, case studies, and participant observation.
Primary data are data gathered by the researcher in the act of conducting research. Secondary data, on the other hand, consists of previously existing data created for other purposes and accessible from a variety of sources, such as government reports, trade publications, market research reports, statistical abstracts, or newspapers.
Longitudinal Surveys
The longitudinal survey is the primary quantitative method used to generate primary data on impact. In a quasi-experimental study, the longitudinal survey consists of a baseline survey and at least one follow-up survey of program participants (treatment group) and non-participants (control group) administered after a sufficient period of time for impacts to occur, typically two years or more. In certain situations, a cross-sectional survey administered at only one point in time to program participants and non-participants may substitute for a longitudinal survey. Cross-sectional surveys, however, are much less likely to explain program impact than are longitudinal surveys, and thus, cross-sectional surveys should be used sparingly when longitudinal surveys are not possible and with recognition of their limitations.
Survey Questions
The decision on which type of questions to include in the survey is subject to a number of considerations:
- The questions must cover the hypotheses identified in the causal model to the extent possible. Certain hypotheses, however, do not lend themselves to quantitative measurement through household surveys. Examples include sector-level impacts, which are thus typically addressed through interviews with sector stakeholders and secondary data.
- The questions must be clear and must elicit meaningful responses. A pilot test of the survey is essential to assure clear and meaningful questions. Internal checks provided by covering the same issue with a different type of question in the survey can also be useful. If the survey is to be translated into a different language or languages, the standard method to ensure clarity is to translate the survey into the relevant language(s) and then back again into the original language.
- Closed-end questions are generally preferred to open-ended questions. Closed-ended questions are easier to use because they are pre-coded whereas open-ended questions require coding after-the-fact. The larger the survey and the greater the variety of responses, the more difficult it is to code answers after-the-fact. Notwithstanding, open-ended questions can be useful in situations in which answers cannot reasonably be anticipated before-hand or in which a greater diversity of responses is sought.
- Questions should not be offensive or threatening. If they are, subjects may refuse to answer or give vague or misleading answers. On the other hand, some legitimate subjects of survey research necessarily delve into personal or potentially threatening or offensive topics. If the survey must venture into potentially threatening or offensive territory, it becomes increasingly important to vet the survey with local experts and to pilot test it prior to implementation.
Survey Structure and Length
In addition to getting the questions right, survey mechanics must be carefully structured. Each survey should be individually numbered, the survey should be logically organized and sections ordered, response codes must be clear, and other enumerator instructions must be clear and easily readable. In addition, information about the enumerator and the date and location of the interview should be included. This information is essential for field supervisor checking of enumerators and for the follow-up surveys.
The length of the survey must also be carefully controlled. If the survey is too long, respondents may not finish the interview, or they may grow fatigued, resulting in a decline in the quality of information. Long surveys also require a greater investment of time on the part of the enumerators, which costs more and is often unnecessary when a shorter survey instrument can adequately cover the major research questions.
How long is too long? There is no ideal length. The Kenya tree fruit survey included 96 questions, although not every question applied to all respondents, and few respondents were required to answer every question. A rule of thumb is that surveys should take approximately one hour to complete on average, although in certain situations they can go longer than this, but preferably not too much longer.
Survey Sampling
Another consideration in conducting a survey is how the sample is drawn. The sample will ideally be a random sample drawn from the entire population of potential program participants, as is the case in randomized experiments. In a randomized experiment, the program randomly assigns persons meeting program entry criteria into the participant (treatment) group or into the non-participant (control) group (frequently withholding program interventions from the non-participant group until a later date).[4]
Randomized experiments, while ideal, are often infeasible. It may be difficult or impossible to convince program management or program implementing partners to withhold interventions from a randomly determined group of persons, for ethical or practical reasons. In the first case, there may be ethical objections to randomly withholding important services from deserving persons. In the latter case, program management will often have reasons why it wishes to work with certain persons first (such as ease of access, greater need, political debt to some group, etc). Aside from this, many impact assessments are begun after the program has already targeted a group or extended benefits to it.[5]
In practice, randomized experiments are not used as often used as other sampling methods that rely on less precise methodologies. More common than random experiments are “quasi-experiments,” in which survey samples are drawn with less perfect randomization and on the basis of imperfect information on the program population but with efforts to match treatment and control groups according to observable characteristics (e.g., demographic characteristics) and unobservable characteristics (e.g., entrepreneurship, attitudes, dynamism, openness to innovation, risk orientation, etc.).
Survey Sample Size
Regardless of the sampling methodology, the sample should be large enough to ensure a statistically significant subset of program participants in each analytical category of interest. Analytical categories are the categories used to analyze the survey results. They correspond for the most part to the mediating variables discussed above, either in isolation (e.g., gender) or in combination (e.g., gender and location). As a rule, an analytical category must include 32 valid responses to yield statistically significant results.
In quasi-experimental assessments, the survey sample must also be large enough to accommodate survey attrition—respondents dropping out of the survey between the baseline and follow-up—so that statistically significant groups among those originally interviewed are still available for the follow-up survey.[6]
Analysis of Survey Data
Yet another consideration in conducting survey research is how the data are analyzed. Such analysis has two objectives. The first objective is to test the impact hypotheses specified in the causal model. The second objective is to explain the causal mechanisms accounting for observed impacts (both positive and negative) and to explain the lack of impact in cases where no impact is found. In simple terms, the impact hypotheses are tested by observing and comparing the changes over time in the participant and non-participant groups, noting the direction and size of the changes, and determining whether any differences between the two groups are statistically significant. The impact analysis may also compare and test changes over time between different analytical groups within and across participant and non-participant samples. Explaining the impacts, or lack of impacts, requires a more in-depth analysis of the impact, mediating, and contextual variables complemented by findings from the qualitative research where such exist.
To illustrate the above points, take a hypothetical impact assessment of a program for fruit farmers in Ecuador. Do program participants, as hypothesized, earn more on average than their counterparts marketing the same products from the same size farms in a similar location? If so, what are the mediating variables that shape this outcome? Does, for example, the program intervention (training; introduction of fertilizers, insecticides, improved seeds, and new farming techniques; and the formation of producer groups) account for the difference? Do other mediating and contextual variables such as location, land ownership, access to credit and to markets, soil type, climate, local economic conditions, etc. also help explain observed differences?
Using a variety of analytical procedures, the analysts will take the coded data entered into the computer format prescribed by the relevant statistical program and determine the extent to which the hypothesized relations can be verified. The stronger the statistical relationship, the stronger is the evidence for impact. Complementary qualitative data are rarely sufficient by themselves to demonstrate impact, but they can serve as important corroboration for the quantitative findings in addition to providing critical contextual understanding to understand why and how impact has or has not occurred. Of course, qualitative information may contradict the quantitative findings, in which case, researchers must use the information and tools at their disposal to explain the contradiction.
Quality of Survey Data
A final point is that the statistical analysis is only as good as the data it uses. If the data are not entered properly and carefully, statistical tests will be meaningless. This is why it is so important to “clean” the data prior to analysis. Data cleaning involves, for example, correcting coding and data entry errors, eliminating extreme outliers, coding open-ended questions, and checking for internal consistency in the results. It is very common that these actions will result in having to re-enter some data, but the time (and cost) should not be spared.
The implementation of quality control measures during the survey implementation and data entry will minimize the amount of data cleaning required. Common survey quality control methods include (1) assigning supervisors to observe data collection, (2) reviewing completed surveys for completeness and accuracy, (3) contacting respondents to confirm that they were surveyed, and (4) resurveying respondents to confirm the responses recorded. These methods are best done on a random basis. Common data entry quality control measures include random checks on data entry and double data entry. Double data entry involves entering the data twice into separate data sets using different keypunch operators. Any discrepancies between the two data sets are resolved by going back to the completed survey forms. All requirements and methods for quality control should be negotiated and made explicit prior to the beginning of the survey as part of the research team’s contractual responsibilities.
Qualitative Data
The better impact assessments rely not only on survey research but take a mixed-method approach using qualitative methodologies as well. Longitudinal survey data are extremely important for a good impact assessment. Quantitative methodologies, if used appropriately, can achieve high coverage and representativeness, while yielding accurate data and generalizable results. They have a limited ability, however, to grasp qualitative information, complex relationships, reverse causality, and potential negative impacts. These shortcomings bring into question the accuracy of any attributions made. For this reason, qualitative methodologies, along with secondary data, are also employed to allow researchers to understand why or how impact have or have not occurred.
Qualitative methodologies allow for in-depth analysis in order to capture complex causal relationships and contextual information against which results can be properly understood. They can be fairly flexible in their design, allowing the investigator to probe and add more questions as the interview or case study proceeds in order to gain greater insight into a program’s context and into the attitudes and reactions of people. They tend, however, to be limited in coverage and are by nature non-representative.[7] Accordingly, they produce less reliable results in terms of standardization of data, representativeness, and ability to generalize and quantify impact.
Like quantitative methodologies, the value of qualitative analysis depends on the quality of the data. The quality of qualitative data depends in turn on the ability of the researchers. Collection and analysis of qualitative data requires researchers to look past the superficial and glean information from what is said both explicitly and implicitly. It requires the researcher to probe, judge the intensity of feelings, tease out trends, draw inferences, manage group interaction, and interpret nonverbal cues. Where the researchers are good and where subjects are carefully chosen to represent important groups or persons, qualitative research can provide insights otherwise unobtainable.[8] Done well, qualitative methodologies are invaluable adjuncts to quantitative data. But the limitations of such data are clear. One cannot assume that responses are representative however carefully the participants/interviewees are chosen.
Secondary Data
Secondary data can also contribute important insights to understanding and explaining impact by providing information on the history and context in which the program is operating. The more the researcher knows about what shapes and affects the program and its corresponding value chain, the more she is able to draw up hypotheses and interpret results.
Many sources and types of secondary data exist. The type of secondary data accessed depends on the questions asked and the sources of data available. Taking the Kenya tree fruit assessment as an example, relevant questions might include:
- What kinds of business development services are generally available?
- What kinds of markets exist within the country and in the export sector?
- What kinds of registration, tax and export regulations exist? How has this sector been changing overall in the country and how does it fit into the overall, economic picture of Kenya? What kind of government extension support exists?
- What projects already work with (or propose to work with) this sector?
- What are the resources for loans and what is the role of intermediaries?
- Has there been (or has there arisen since the start of the program) any major climatic or civil crisis (like a drought, a plague of insects, a civil war) that would distort the assessment findings?
Answers to these questions might be found in reports and data published or provided by a number of sources, such as the national government, multilateral development organizations, the USAID Mission, producer associations, banking supervisory authorities, market research firms, local economic development entities, and national or regional microfinance networks.
Combining Data Sources
The final question is how researchers use and integrate the different kinds of data sources they have available. The answer is that these are not sequential but concurrent sources that must be knitted together to make one pattern. It is not a matter of first collecting background information, then developing the hypotheses and conducting surveys, and then doing focus groups and/or interviews. These things can and should overlap continuously. Secondary information is collected both at the beginning of the study and as the research continues to mark how the overall situation (outside the project) is changing and what are the major social and economic events that might affect the project. Qualitative research in the beginning, middle and end of the assessment provide not only explanations for what researchers are observing from other sources but also generate ideas for how analysis may need to be changed to take into account new phenomena. (In practice, however, it may not be possible to conduct multiple rounds of qualitative research due to logistical or budgetary constraints.)
To demonstrate how different types of data can be knitted together to improve understanding of impact, consider the hypothetical fruit program in Ecuador. A hypothesis identified in the causal model held that male farmers earned more on average than their female counterparts. The conventional wisdom was that men produced (grew, harvested and sold with some help from female family members) fruit “A” and women fruit “B” (with men providing only transport). Neither was believed to have any access to credit, nor to markets outside the local area. Based on this local knowledge, the program planned to provide assistance (training in new technologies, marketing, and help obtaining credit) to both men and women with different programs targeted to different fruits and genders.
The baseline survey research, however, showed that women were in fact as likely as men to grow to fruit A and that the men (but not women) growing fruit A actually did have access to small loans and had established contact with an exporter in the capital city. How then to understand this apparent disastrous misunderstanding by the program in the first place? The answer was provided by a focus group of Fruit A growers and some in-depth interviews with government extension agents and fruit growers in the region. Cessation of hostilities with groups across the border in Colombia, right after the program began, had resulted in the sudden opening of new economic opportunities in the region. Men, who had had the least prosperous business in fruit A had moved to these jobs because they could earn more. The women in their families, who did not have the mobility to take these new jobs, had replaced them. Credit had meanwhile become available to male fruit growers with a certain level of collateral because of a new agricultural bank subsidized by the government. In addition, a USAID-funded program for fruit exporters was opening opportunities for small-scale fruit producers.
Understanding these factors led the program to redirect some of its activities, while the researchers adjusted their research plan to add some new questions (keeping the old for comparability) and slightly reconfiguring the follow-up sample. The original survey results remained valid having established a baseline against which follow-up results for both participants and non-participants could be compared after accounting for changes in hypotheses, survey, and survey sample.
In this example, the qualitative information was essential for understanding what was going on in the environment and with the program, and it proved indispensable for both the program itself and the research. Using baseline survey results alone, it would not have been possible to conclude that “most poorer male producers of fruit A feel that other economic opportunities will offer more to their families” because there was no quantitative evidence of this conclusion. But, by integrating the focus group findings with the survey results, the baseline report was able to reach this conclusion. Later in the follow-up survey, statistical data confirmed what had been suggested in the baseline and showed that the project, by training and helping get credit available to farmers without collateral (both male and female), had made a significant difference in the net profits and viability of fruit growers and had decreased the discrepancy in profits between male and female fruit growers.
What should also be clear from this example is that a well-designed impact assessment based on mixed methodologies can, and should, be of use to the PSD program beyond proving/disproving that the program had achieved its intended impacts. Mixed methodology impact assessments offer much potentially valuable information for the program that can be used to adjust target goals or change project strategies.
Footnotes
- ↑ Jennefer Sebstad and Don Snodgrass, "Assessing the Impact of the Kenya BDS and the Horticulture Development Center Projects in the Treefruit Sector of Kenya: Baseline Research Design." Washington; USAID Micro report #9 (September 2004), p. 16.
- ↑ A forthcoming paper in the Primer Series will address in greater depth the different types of variables and their analysis.
- ↑ "Ibid., p. 23.
- ↑ For a discussion of randomized experiments and other sampling methodologies, see Lucy Creevey, (2006), “Methodological Issues in Conducting Impact Assessment Assessments of Private Sector Development Programs,” Impact Assessment Primer Series paper #2.
- ↑ In such cases, it may still be possible to conduct a randomized experiment if it is planned in conjunction with program expansion.
- ↑ There is still an unavoidable problem. Even if the sample is big enough to assure large enough numbers of observation after attrition, there may be attrition biases unless the attrition is random. In good impact studies, researchers will attempt to discover if there is an attrition bias and will incorporate its implications into the data analysis and final report.
- ↑ Because qualitative methods are by nature non-representative, they are not applied on a random basis to a cross-section of program participants and non-participants but are best applied in a targeted manner to specific groups or persons who are believed to possess insights to specific questions.
- ↑ A common practice among qualitative researchers is to convert qualitative data into numeric or categorical data through tally sheets and analytical matrices. Although such grid/matrix approaches are appropriate methods for analyzing qualitative data, if applied too mechanistically these methods may dilute the richness of information embedded in qualitative data. If the main objective is to compute frequencies with which clients identify certain issues, surveying a representative sample of clients is the preferred method.