
3.2.5. Value Chain Mapping Process
Introduction
It is recommended that value chain mapping be conducted in two phases; a) an initial basic map after the collection of initial data illustrating participants and functions, and b) adjusted mapping, which is conducted following additional and follow-on interviews. The detail level of the map depends on mission objectives and requirements established at the outset.
The steps for putting together a value chain map are as follows:
- Collect data from secondary sources, key informant interviews and/or surveys
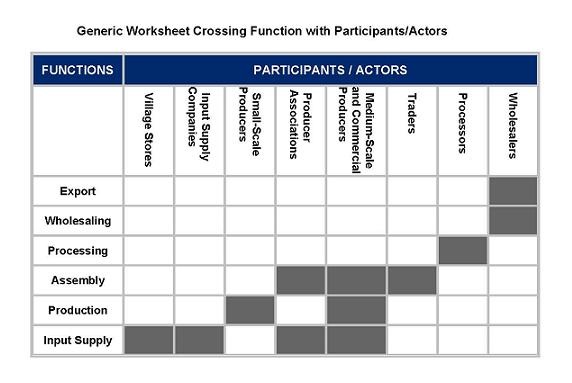
- Use a function/participant worksheet, which includes the following elements:
- input supply
- production
- assembly
- processing
- wholesale
- export
These elements help to organize key information about who is doing what in the value chain. The GEMINI project developed the worksheet below to facilitate this step. Filling out the model table below can greatly facilitate drafting the value chain map. (Note: An actor can accomplish more than one function.)
- Draw the map using the basic map format. There are no rigid rules to value chain mapping, but to facilitate information sharing, the following are suggested presentation guidelines:
- List end markets across the top of the map.
- List functions down the left side of the map.
- Fill in participants/actors according to their functions and markets, presented as block forms with inserted text in each entry. If participant/actors are involved in more than one function or market, extend the block to reach the relevant functions/markets. If their functions are not consecutive in the chain, the skipped function block is presented with dotted lines. Actors should be grouped by categories of firms rather than individual firms by name.
- Draw the linkages between participant blocks with arrows in the direction of the product flow.
- Define clearly market channels in a vertical manner culminating at end markets at the top of the map.
- Include additional information relevant to the chain analysis. Examples include:
- Identify categories or specific supporting service providers on the right side of the map.
- Present value chain governance by different types of connecting arrows showing a variant governance patterns associated with separate market channels.
- Add data overlays when relevant and helpful for the chain analysis. Overlays are represented by:
- Number of firms with N (N =__)
- Sales with S (S= __)
- Employment with L (L=__)
- Volume with V (V=__)
Basic Maps
The sample basic value chain map below, developed for a horticulture analysis in Tanzania, shows market channel differentiation from the producer level on up to either an export or a domestic consumer market.

A basic map should answer the following questions: “What is being done in the value chain?” “Who are the key players that are doing it?” “How is the product/service reaching end markets?” “What market channels are available to reach those end markets?”
Detailed Maps
The basic map can be expanded by adding more information and statistical data gathered during data collection. It then becomes a detailed map and will contain some of the following elements:
- Supporting markets—as the value chain grows and more product and money flows up and down the chain, there is an increased demand for support services. Supporting markets consist of individuals or firms that provide critical services to value chain participants (inputs, capital, know-how, technical assistance), but who do not own or purchase the product as it moves toward the end markets.
- Value chain governance—the power dynamics wielded by different kinds of actors in an industry.
- Data overlays—quantitative information such as number or percentage of MSE at each functional level, number of employees of a large dominant firm, average land size (for agricultural production), volumes sold, input costs, sales revenue, unit price and net profit as well as more detailed information about specific firms in the supporting markets.

The detailed map above maintains the functional levels on the left, while the supporting market column on the right is replaced with “market actions” in-country and once exported. The required level of information overlaid on the map depends on the detail of the analysis and the requirements of the donor.
Limitations of Mapping
Mapping is a simple tool; while it is important, it has limitations:
- It does not show value chain dynamics, changes and trends of the chain. By definition, the map is a static snapshot of the value chain structure and cannot adequately represent factors that influence the conduct of individual value chain participants.
- It does not show end market requirements and opportunities. The map indicates final product markets, and at times, segmented market channels, but this does not explain the structure or dynamics of end markets.
- It only provides superficial information on supporting markets. The map generally only shows generic categories of support service providers such as “financial services" and says little about access to these services.
- It does not provide information on the enabling environment. Mapping is too simplistic a tool to describe the business enabling environment and its impact on value chains.
- There is a tendency to spend too much trying to refine the map and trying to reach agreement, rather than using the map as one of several tools to identify constraints to market opportunities.