3.1.5. Ranking Matrix
A Case from Madagascar
This example, from an assessment conducted in Madagascar for the aromatic and medicinal plant industry, included the following selection criteria: competitiveness, poverty reduction (impact), and cross-cutting issues of positive impact on the environment and on health. Criteria were weighted from 1 (least important) to 3 (most important) according to their relative significance. Each value chain was then assessed and assigned a rank of 1 to 5 for each criterion. Multiplying rank with weight yields a weighted score for each criterion, which was adjusted to give a maximum score of 10. The vertical sum of these yields a score for each value chain adjusted to give a maximum score of 100. In principle, the value chain with the highest score has the optimal potential for the criteria identified. However, the matrix suggests a level of quantitative rigor for a decision-making process that was largely qualitative. For example, the scores for ginger and cinnamon, 64.2 and 62.6, respectively, are close enough that a minor change in criteria or weights would reverse the highest score.
| Criteria | Category Weight | Criterion Weight | Product Score | ||||||||
| Cinnamon | Cloves | Coffee | Ginger | Jatopha | Litchis | Ravenstata | Red Rice | ||||
| A | Competitiveness (subtotal) | 2 | 7 | 6.0 | 5.1 | 5.7 | 7.1 | 5.7 | 6.3 | 5.4 | 5.7 |
| 1 | Current market size | 2 | 2 | 3 | 5 | 3 | 2 | 3 | 2 | 3 | |
| 2 | Current market share | 1 | 3 | 2 | 2 | 3 | 2 | 2 | 1 | 2 | |
| 3 | Dynamic market trend | 2 | 3 | 2 | 2 | 4 | 4 | 4 | 3 | 3 | |
| 4 | Perceived product quality | 2 | 4 | 3 | 2 | 4 | 3 | 3 | 4 | 3 | |
| B | Impact (subtotal) | 2 | 8 | 5.3 | 3.3 | 3.5 | 3.8 | 2.8 | 4.0 | 2.3 | 3.5 |
| 1 | Number of rural households benefiting/ participating in the chain | 2 | 2 | 2 | 3 | 4 | 1 | 3 | 1 | 3 | |
| 2 | Income potential | 2 | 3 | 3 | 2 | 2 | 3 | 3 | 2 | 3 | |
| 3 | Synergy with other client investments | 1 | 4 | 3 | 4 | 3 | 3 | 4 | 3 | 2 | |
| 4 | Industry leadership | 1 | 1 | 1 | 3 | 1 | 2 | 3 | 3 | 2 | |
| 5 | SME and MSE presense or potential | 2 | 3 | 3 | 4 | 4 | 3 | 2 | 3 | 3 | |
| C | Environmental Impact (subtotal) | 3 | 5 | 6.8 | 6.0 | 6.0 | 7.6 | 6.0 | 6.0 | 6.4 | 5.6 |
| 1 | Harvest/ production impact |
2 | 4 | 3 | 3 | 5 | 3 | 3 | 3 | 3 | |
| 2 | Agro-ecosystem complexity | 1 | 3 | 3 | 3 | 3 | 3 | 3 | 4 | 2 | |
| 3 | Endemism | 2 | 3 | 3 | 3 | 3 | 3 | 3 | 3 | 3 | |
| D | Health (subtotal) | 1 | 5 | 7.2 | 6.4 | 6.0 | 6.8 | 6.4 | 6.8 | 6.4 | 6.8 |
| 1 | Women's income opportunities | 1 | 4 | 4 | 3 | 3 | 4 | 3 | 4 | 3 | |
| 2 | Income opportunities for food insecure househoulds | 2 | 4 | 3 | 4 | 3 | 3 | 4 | 3 | 3 | |
| 3 | Potential impact on food crops | 2 | 3 | 3 | 2 | 4 | 3 | 3 | 3 | 4 | |
| TOTAL | 8 | 62.6 | 51.5 | 53.0 | 64.2 | 51.7 | 56.7 | 51.2 | 52.5 | ||
A Case from Zambia
Ranking matrices need not be complicated as illustrated in an example from Zambia below. In this case, weights have not been applied and ratings use high, medium, or low rather than numerical values. Each of the three criteria considered use two related sub-criteria: growth is estimated in terms of market growth and market share; scale is measured through the breadth and depth of impact on MSEs; and leadership is valued in terms of a commitment to MSE participation in the industry and a commitment to the competitiveness of the industry as a whole.
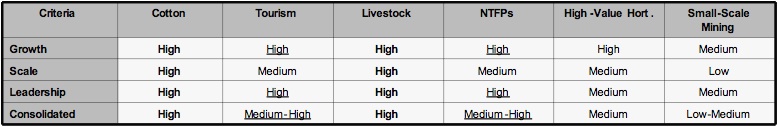
The results of this ranking process can be displayed in a bubble graph to facilitate comparing the respective chains and assigning a consolidated score.

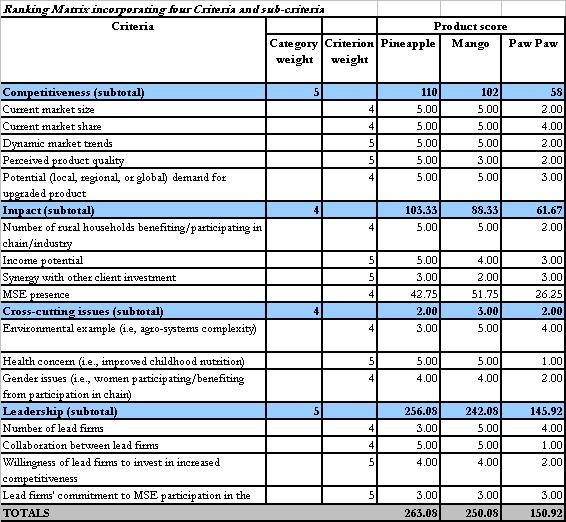
An Illustrative Ranking Matrix Incorporating all Four Criteria