
5.3.2. Quantitative Analysis
Introduction
USAID's value chain analysis methodology focuses on qualitative analysis to understand trends, incentives and relationships. However, quantitative analysis also plays an important role in value chain analysis by illustrating the current situation and revealing inefficiencies that can be addressed to increase competitiveness. Quantitative analysis involves mapping the pattern of value-added distribution along the chain; measuring profitability, productivity and production capacity; and comparing the performance of a firm, value chain, or value chain actor against its competitors.
Mapping Value-Added Distribution
The first step in mapping the distribution of value added is to record prices (i.e. gross output values) at the different stages in the chain for one unit of a good beginning at raw material and ending with the final product sold to the consumer. Next, to assess the value added at each link, total input costs (such as bought-in materials and contracted services) need to be subtracted from the recorded prices. This exercise identifies the roles of each segment and the incremental value that the market assigns to each role based on additional inputs and services to the product. The results are typically presented in a graph like the one below. This example shows the build-up of the net revenue of one kilogram of Mongolian cashmere from herder to retailer. Over 60 percent of the value of the end product is captured by the knitting, wholesaling, and retailing activities. These analyses lead to a strategy for stakeholders to invest in knitting part of the value chain.
Mongolia: Net Revenue per kg of Cashmere for each Function in the Value Chain

Data must be collected from primary sources by interviewing (or surveying) a representative sample of key respondents in each link of the chain (sales and finance functions of the economic unit would be the most helpful). The analyst should triangulate information between buyers and sellers. Typically, value chain actors’ participation is promoted in workshops where preliminary results can be refined and validated.
Other difficulties that are likely to be encountered stem from the fact that certain value-adding activities, such as marketing, design, or production, will not always correspond with the activities of individual economic units (i.e. some firms may be vertically integrated and perform most of the value-adding activities while others firms could be more specialized). Additionally, there could be different technology and or production methods involved (and thus different business models). Likewise, products sold in different markets or at different times of the year can fetch different prices. In these cases, it could be useful to create multiple scenarios to account for these differences.
It is also important to note that value-added can also be quantified per activity within each economic unit (such as a firm, plant or a farm). Indeed, the role each discrete process plays in adding value can also be measured and benchmarked against those of competitors. This information is typically more difficult to obtain and would require that value chain participants employ activity-based accounting systems. Overall, the objectives set forth by those conducting the analysis and the amount of resources at hand will determine how deeply value distribution is analyzed.
Measuring Profitability
After capturing the value added at each link in the value chain, the next step requires the analyst to establish the relative profitability of each activity. To do this, more detailed data on costs are needed- including material costs, depreciation costs, labor costs, financing costs, utilities, and the profit margin at each stage. This data can be obtained by adding more inquiry points to the interviews and surveys described above, and can also be validated at workshops.
Next, several ratios can be calculated. A common example is the profit margin (or mark-up) expressed as a percentage of the price (or of total production costs incurred). However, this measure may paint an inaccurate picture, since the value of the mark-up on sales or costs is dependent on the volume of sales (and the sale price itself, which differs at each link in the chain). Using this measure, economic units may appear to have lower profitability, but it is more than compensated by the greater volumes they operate with. Additionally, this measure does not account for the size of the investments made by each economic unit. An alternative is to express the mark-up as a percentage share of total value chain profit, but this still does not take into account the size of the investment of each economic unit.
Thus, the return on net assets at each link would take account of the size of the investment committed among economic units in the chain, and therefore is a more accurate measure when comparing relative profitability among the value chain links, but will require even more detailed data collection than what has been described above and examine the full balance sheet of the value chain participants. This measure is analogous to measuring the efficiency with which capital is employed (i.e capital productivity). The section below discusses this more fully as well as other ways in which productivity is assessed.
Measuring Productivity
Productivity measures the efficiency of economic units in employing resources in the production process. It is frequently expressed as a ratio of output over input. Productivity measurements are useful for tracking changes over time in a firm or value chain to assess and bring about improvements, and for benchmarking against competing firms and value chains. Productivity measures are important indicators for potential investors and customers, as well as for managers--who use them to determine how efficient their firms are and to identify upgrading strategies.

Total factor productivity (which takes into account the cost of all inputs) is expensive and difficult to calculate, so proxies are typically used in calculations of productivity. For the output side of the ratio, revenue or physical output production is often used, divided by units of a factor of production like labor or land. Some industries have adopted a standard way of expressing productivity, based on the intensity of use of a key production factor or drawing on readily available data. Standard productivity indicators in the illustrative sectors below are as follows:
- Retail -- sales per square feet
- Manufacturing -- sales per employee
- Agriculture -- production (tons)/hectare
A good example of productivity analysis is given by the Armenian Development Agency, which was trying to promote investment into the Armenian information technology (IT) services and software sectors. The time-series in the figure on the right shows major productivity improvement over the timeframe 2003-2006, in various subsectors of IT services.
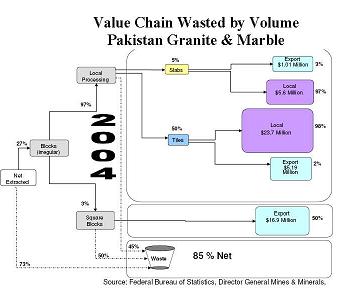
Wastage analysis is another productivity indicator that is often used in quantitative value chain analysis. Wastage can be measured as the value of a resource that never makes it to the final consumer. Some examples of wastage can be the second milking of cows that is never consumed, ICT employees sitting on “The Bench” and not working, or scrap metal from an automotive value chain. Analysis of wastage can help to build the case for upgrading -- for example, through investment in more efficient technology.
For example, in the granite and marble sector in Pakistan, quarry owners were mostly using indiscriminate blasting techniques to extract the rocks from the quarries. Because of this and other inferior practices, 85 percent of the volume of the granite and marble was being destroyed by the blasting. Wastage analysis (see figure on right) was used to create a strategy to reshape the industry through investing in technology to reduce wastage, improving the business environment, upgrading workers' skills, and strengthening industry organizations. Based on these strategies it is estimated that the volume wasted can be reduced to 57 percent.
Well-managed lead firms in a value chain should be measuring productivity and using the information to improve their business operations. Sometimes an industry association will collect productivity data in order to establish industry norms, against which managers can benchmark their firms. In addition, acceptable levels of wastage are often determined by industry stakeholders through a participatory process. If this aggregated data is not available when conducting a value chain analysis, individual firms will need to be interviewed to obtain sales information and other indicators like employment numbers and wastage.
Read more on measuring productivity.
Production Capacity Indicator Analysis
Production capacity indicators measure the productive capacity of a specific value chain. These indicators contribute to value chain analysis in the following ways:
- Identifying key constraints or bottlenecks that limit value chain growth
- Providing information regarding production scheduling
- Informing analysis of key investment decisions to support upgrading in the value chain
Capacity can be measured by cycle time analysis and throughput analysis.
Cycle time analysis measures the time required to fulfill an order placed by a customer. This can be broken up by the time taken by each firm to complete its role in the value chain, or even by each task within an enterprise. This is important because, everything else being equal, buyers or importers will typically prefer shorter cycle times to limit the amount of expensive inventory they have to hold. Additionally, certain specific market segments can only be served if the cycle time is sufficiently short. For example, accessing some niche markets in the fast fashion sector requires the ability to complete orders within a two-week cycle. Likewise, many agribusinesses, especially those with dealing with fresh produce, require products to be delivered to market in a specific, usually short, period of time. Reductions in cycle times typically lead to increased access to higher-value markets. The diagram below illustrates an example of a cycle time analysis.

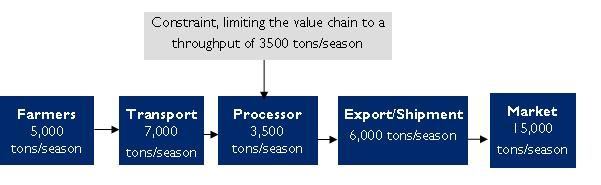
Throughput analysis is the amount of product or service that can be produced in a given time in a value chain. The analysis can be broken down by each step in the value chain or even each task within a firm in the value chain. Throughput analysis can pinpoint the bottlenecks or constraints that limit the production capacity of the value chain. The diagram below demonstrates how a throughput analysis would be created.
Read more on production capacity analysis.
Value Chain Benchmarking
Benchmarking analysis involves comparing the performance of a firm, value chain or link in the value chain to its competitors. Through benchmarking, industry stakeholders can establish their current relative performance and generate a “menu” of potential actions that could lead to improved performance and competitiveness, based on an understanding of what competitors do differently, and whether these differences are important drivers of performance. Thus, benchmarking exercises provide crucial input into competitiveness strategies and upgrading plans.
The value chain benchmarking process is straightforward and generally includes the following steps:
- Determine what indicators and measures should be benchmarked.
- Identify the competitor value chains against which to make comparisons.
- Gather and analyze the data.
The table below provides an example of a benchmarking exercise. In this particular case, eight critical success factors were identified by the analysts as driving competitiveness in the global cigar industry. Some of these factors, such as sales volume and research and development capacity, apply to other industry sectors also, while other factors, such as flavor and the availability of specialized packaging, are specific drivers of this particular value chain.
| Critical Success Factors | Dominican Cigars | Cuban Cigars |
|---|---|---|
| Sales Volume | 120 million sold | 80 million sold |
| Flavor | #2 in blind taste tests | #1 in blind taste tests |
| Packaging | Imported wrapper | Local wrapper |
| Research and Development Capacity | Weak (but improving) | Strong |
| Distribution Channels | Mostly sells to Davidoff, etc. | Controls European distribution channels |
| Final Market | Over-reliance on US embargo of Cuba | Strong European penetration |
| Industry Management | Dynamic enterprises | State-owned enterprises |
| Marketing | Rising image as a "cigar country" | Strong "Cuban" brand |
Read more on benchmarking.